Ability Beyond Disability: Understanding Accessibility

Published in the June 2013 issue of Public Relations Tactics 
Diversity Dimensions 

What is accessibility?
One of the first steps in understanding how communicators can reach audiences of people with disabilities (PwDs) is to understand exactly what accessibility is and why it is so critical.
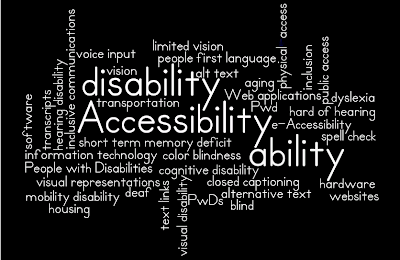
word cloud of words: ability disability PwDs Pwd People~with~Disabilities e-Accessibility physical-access transportation, public~access, housing, IT, information~technology hardware software Web~applications websites aging visual~disability blind limited~vision vision color~blindness hearing~disability, deaf, hard~of~hearing, visual~representations, closed~captioning, transcripts mobility~disability voice~input cognitive~disability dyslexia short~term~memory~deficit inclusion inclusive~communications people~first~language alt~text alternative~text text~links spell~check Accessibility“Accessibility is a measure of the extent to which a product or service can be used by a person with a disability as effectively as it can be used by a person without that disability,” according to the e-Accessibility Policy Toolkit for PwDs.

People often use the word in terms of physical access in areas such as transportation, public access and housing. With respect to information technology (IT), accessibility means enabling IT hardware, software, Web applications or websites so that more people can use them, either directly or with assistive technology.

Others use the term to specifically talk about Web accessibility. The World Wide Web Consortium, an international community that develops Web standards, says: “Web accessibility means that people with disabilities can perceive, understand, navigate, and interact with the Web, and that they can contribute to the Web.”

We include the aging population in this broader category of people who can benefit from technology created for PwDs because by 2025, this segment will grow to comprise 20 percent of the population in most industrialized nations, according to the World Health Organization. As people get older, they essentially join the PwD population through the acquisition of age-related disabilities, such as limited vision and reduced hearing.

The 4 Main Categories of Disabilities 

To understand accessibility, you should be familiar with the four main categories of disabilities: visual, hearing, mobility and cognitive. Technology accommodations exist for each of these disabilities, but must be implemented for PwDs to eliminate or minimize the barriers to access.
  • People with visual disabilities are blind, have limited vision or have color-blindness. 
  • People with hearing disabilities are deaf or hard of hearing and require visual representations of auditory information, such as closed captioning or transcripts. 
  • People with mobility disabilities can have difficulty with movement and fine motor controls, limiting typing or mouse control. Alternate input capabilities, such as voice input, are often required. 
  • People with cognitive disabilities, such as dyslexia and short-term memory deficit, may have limited ability to perceive, recognize, understand, interpret or respond to information. Consistent design and simplified language are two helpful solutions. 

Guidelines for Inclusion 

Inclusive communications by definition don’t exclude anyone. To ensure that your communications are accessible and inclusive, follow these guidelines:
  • Use people-first language, such as, “people with disabilities” instead of “the handicapped or disabled.” (See the TCDD website for a full list of terms.)
  • Do not use color to convey meaning. When content is presented by color alone, a person who is blind or color-blind will miss that information. 
  • Add alternative or “Alt” text for relevant images, charts and graphs. 
  • Use text links instead of URLs. Screen readers often have a links list function that shows all of the links. 
  • Provide sufficient contrast between background and text. 
  • Always use spell check. 
 Accessibility is about all of us. It extends the capabilities of technology to accelerate social innovation and create shared value for all citizens. Without accessibility, there isn’t inclusion. And inclusion matters, because excluding any individual means missing out on unique ideas, insight and opportunities.

Three Incredible Infographics

Infographics are amazing. They are a fast and easy way to convey a large amount of information quickly and succinctly, as you can see by this, you guessed it, an infographic explaining infographics. Which by the way, useful as it is, I'm not including it as one of my three incredible infographics because it's not new.

What is an Infographic?
Created by Customer Magnetism, an award winning Digital Marketing Agency.

I wrote a blog post last year, Infographics: The Graphic Visual Explosion, and if anything, I'd say infographics have become even more popular in the last nine months.

Here are three of the most incredible infographics I've seen pass through my feeds this week, and I can't help but share the wealth; something most social media practitioners seem almost supernaturally compelled to do. (Hmmm, I think there's a blog post here.... every time I see an amazing article, image or infographic I immediately start mentally crafting my tweet or Facebook post about it.)

I can't decide which of these is my favorite, so I'd love to hear which one you like the best.

This first one, designed by Marketo, which shows us some of the numbers associated with cat and bacon searches, is utterly brilliant. Social Media Today has a great article, Why Marketing That Includes Cats and Bacon Is the Cat’s Meow, that actually suggests some ways you can integrate these popular cat and bacon memes into your small business marketing plan.


The second one, created by eBay Deals, illustrates 16 examples of viral philanthropy, via crowdfunding sites such as indiegogo.com, giveforward.com and gofundme.com, and even reddit, for the victims of natural disasters such as earthquakes and hurricanes, victims of large-scale shootings, and others who have pulled some heartstrings.

This is a screenshot of the top of a very long and narrow infographic.Click on the link above to see it all.

The final one in my trifecta of favorites is Every Second on the Internet, a brilliant and interactive infographic from designly.com showing, in real-time visuals, how much data is streaming through the Internet every single second. You have to see it in action — this still shot doesn't begin to do it justice.

This also is just a screenshot of a tiny part of the entire piece. Click on the link aboveto see it all.


This is just the beginning, and we'll continue to see great strides in function and creativity. Infographics do not translate well to mobile, nor are the majority of them, including these, accessible in their current form to people with visual disabilities.

The Latest in Accessibility News from TED

If you've been following my blog for a while, you'll know that I'm a passionate advocate of accessibility, having worked in the field for over 10 years, and a strong proponent of the power of TED, just this year joining the core team for my local TEDxSanJoseCA and managing its social media presence.

I'm still blown away by the outstanding quality of everything TED does. The range of topics is vast and cutting edge. Videos are captioned for people who are hearing impaired, English-as-a-second-language learners, or temporarily disabled (in an airport or coffee shop where the sound can't be heard). TED Talks are always 18 minutes or less, and I learn something new and amazing from every single one. My only complaint is that I can't keep up with all of the amazing content TED uncovers and shares.

TED is continuing their reputation for excellence and expanding the theme of "Riveting talks by remarkable people, free to the world", with these wonderful essays, blogs, and talks on blindness and vision.

Fittle: An accessible learning toolset for visually challenged kids  


The shape of things: Fellows Friday with Anthony Vipin Das, on FITTLE, a toy that helps blind children read includes an essay written by TED Senior Fellow Dr. Anthony Vipin Das, an ophthalmologist who is working with Tania Jain, a designer from National Institute of Design, Gandhinagar, on FITTLE, a toy to help blind children learn to read Braille while getting a sense of the shape of the world around them.


As Dr. Vipin Das says in his essay, "This new toy, which we call FITTLE (“fit the puzzle”), helps children learn individual letters of Braille, construct words, and understand the form of objects, all through a playful game. Essentially, we are changing the way that blind children at a young age are going to perceive the world around them."

"We wish to help spread this idea as far and wide as possible. With current technology, FITTLE can be downloaded through open-source platforms and the pieces can be 3D printed by anyone who wishes to do so."

 A TED Celebration with a Playlist of Talks on Blindness and Sight


The second TED feature that made me sit up and pay attention was a blog post, The second amazing Looking into the future: A stem cell development to cure blindness, plus a playlist of visionary talks.

It references a BBC report, 'Big leap' towards curing blindness in stem cell study, that reveals how a research team in the UK has created a technique to transform stem cells into photoreceptors and inject them into the eyes of mice.

The TED blog then shares a playlist of TED talks on blindness and sight, including:
  • Pawan Sinha on how brains learn to see
  • Dennis Hong: Making a car for blind drivers
  • Sheila Nirenberg: A prosthetic eye to treat blindness
  • Neil Harbisson: I listen to color
  • Beau Lotto: Optical illusions show how we see 
Once again, TED lives up to its tagline "Ideas worth spreading".